7 Best Infrastructure Monitoring Software Tools for IT Teams in 2026
Modern IT infrastructure is more distributed than ever — servers, containers, cloud instances, and on-premises hardware all generating metrics simultaneously. When something fails, the cost hits fast. The ITIC 2024 Hourly Cost of Downtime Survey found that over 90% of midsize and large enterprises say a single hour of unplanned downtime costs more than $300,000. For large enterprises, that figure climbs above $1 million per hour.
The challenge isn't that monitoring tools don't exist — it's that most were built for a simpler infrastructure era. They poll metrics every 30 seconds, require manual agent deployment, and alert on fixed thresholds long after a problem has already escalated.
This article covers seven infrastructure monitoring software options evaluated on real-time visibility, deployment simplicity, scalability, and depth of integration with modern infrastructure stacks.
1. Netdata - best open-source infrastructure monitoring with per-second granularity

When IT teams evaluate the best infrastructure monitoring software, the conversation usually comes down to two variables: how granular is the data, and what does it cost at scale. Most commercial tools poll at 30-second or 60-second intervals — long enough for a spike to resolve and disappear before anyone notices. Netdata collects every second, across every node it discovers, without manual configuration.
It's open-source, deploys in about 60 seconds, and auto-discovers hosts, containers, VMs, network interfaces, and services without registration. Supported metrics span CPU, memory, disk I/O, network throughput, processes, containers, and 800+ integrations across the full infrastructure stack.
The ML layer runs on every collected metric continuously. Its Anomaly Advisor surfaces the 30-50 most relevant anomalies ranked by severity — giving operators a root cause candidate list rather than an undifferentiated alert flood. On GitHub, Netdata has 76,000+ stars and 668 million+ Docker pulls, making it the most widely deployed open-source monitoring tool in the market.
The honest limitation: the cloud management console requires an account, and the metric density can overwhelm teams new to infrastructure monitoring. Simpler tools may serve smaller environments better.
Best for: DevOps and SRE teams that need per-second granularity, open-source flexibility, and AI anomaly detection without per-metric or per-host pricing.
2. Datadog Infrastructure Monitoring - best for cloud-native full-stack observability
Datadog sits at the center of the cloud-native observability market. Its infrastructure monitoring module connects host-level metrics to APM traces, logs, and network data in a unified interface — eliminating the manual correlation that most monitoring workflows require.
Support covers cloud providers, containers, Kubernetes, serverless, and on-premises hosts. AI-driven alerting reduces noise, and dashboards are highly customizable. For teams already running Datadog for APM, adding infrastructure monitoring is a natural extension of an existing investment.
The cost compounds fast. Datadog bills per host, and that charge applies to every monitored instance. Large infrastructure inventories can produce high monthly costs at scale.
Best for: Cloud-native engineering teams already standardized on Datadog who need infrastructure, APM, and log visibility in a single platform.
3. Prometheus + Grafana - best open-source stack for custom dashboards

Prometheus and Grafana are the backbone of open-source observability. Prometheus handles metric collection and alerting via pull-based scraping. Grafana handles visualization — dashboards, heatmaps, and alert panels that pull from hundreds of data sources.
Grafana earned a spot in the 2025 Gartner Magic Quadrant for Observability Platforms as a Leader. It supports multi-cloud, hybrid, and on-premises environments, and integrates with virtually every infrastructure component via community-maintained exporters.
The complexity cost is real. Setting up Prometheus for full infrastructure coverage means configuring separate exporters per service, writing PromQL alerting rules, and managing long-term storage separately. It's a powerful stack, but requires sustained DevOps investment to maintain.
Best for: Teams with in-house DevOps expertise that need maximum flexibility and are comfortable operating their own monitoring infrastructure.
4. Zabbix - best for large-scale enterprise on-premises monitoring
Zabbix is a free, open-source monitoring platform built for scale. It handles thousands of hosts from a single instance, covers network devices, servers, virtual machines, and applications, and supports both agent-based and agentless monitoring.
Auto-discovery reduces the manual overhead of registering new hosts. Alerting is flexible — triggers can be defined with multi-condition logic, and escalation rules route notifications to the right teams. Zabbix supports SNMP, IPMI, JMX, and custom scripts, making it adaptable to legacy infrastructure that modern SaaS tools often can't reach.
The trade-off is the learning curve. Zabbix's interface and configuration model are dense, and new teams typically need several weeks for the platform to run efficiently. There's no managed SaaS option — deployment and maintenance land entirely on your team.
Best for: Enterprise IT teams running large on-premises environments who need a free, scalable monitoring platform and have the engineering capacity to operate it.
5. New Relic - best for application-to-infrastructure correlation
New Relic connects application performance data to infrastructure metrics in a single view. Its APM captures how application services call databases, an external web scraper api solution, and infrastructure components in real time — then links those traces directly to host-level CPU, memory, and disk data.
The platform has 1,083 data source integrations and supports both NRQL and PromQL queries. A no-code Data Explorer lets teams that don't want to write query language navigate infrastructure data visually.
Pricing uses a data-ingest-plus-active-user model. A free tier is available, and mid-tier costs are manageable — but large deployments with high data volumes can quickly escalate.
Teams managing web application stacks alongside infrastructure will find that New Relic's unified view significantly reduces troubleshooting time. For teams maintaining the underlying hosting layer, the guide on hosting features that strengthen agency-driven web projects covers how infrastructure choices affect application delivery.
Best for: Development teams that need unified application performance and infrastructure observability in a developer-friendly interface.
6. Nagios - best for network and service monitoring on legacy infrastructure
Nagios has been monitoring infrastructure since 1999 and remains widely deployed in enterprise environments that predate the cloud era. Its strength is breadth: Nagios monitors network devices, servers, services, applications, and custom scripts through a plugin architecture that covers nearly every infrastructure component.
Nagios Core is free and open-source. Nagios XI is the commercial version, adding a GUI, reporting, and configuration wizards that reduce the raw configuration overhead of the Core version.
The limitations are the interface and the operational model. Nagios was designed for an era when infrastructure was mostly static. Dynamic environments with auto-scaling groups, containers, or ephemeral cloud instances don't fit well into Nagios's host-centric model. Config management through flat files also requires scripting or configuration management tools to stay manageable at scale.
For teams where infrastructure monitoring intersects with data handling and compliance, the risks around everyday data management mistakes are worth reviewing alongside the monitoring strategy.
Best for: Teams maintaining stable, legacy on-premises infrastructure where the breadth of the plugin ecosystem outweighs the operational overhead.
7. ManageEngine OpManager - best for mid-market teams needing network and server monitoring together
ManageEngine OpManager targets mid-market IT teams that need one tool covering both network infrastructure and server performance without separate licenses. It monitors servers, routers, switches, firewalls, and virtual machines from a unified console.
Pricing is more accessible than enterprise-focused platforms, and the documentation is thorough enough that teams without dedicated monitoring engineers can operate it. Alert customization covers thresholds, escalation paths, and remediation actions through a visual interface.
The interface hasn't kept pace visually with cloud-native tools, and the alerting flexibility is less granular than on platforms built in the last five years. Teams evaluating modern cloud toolchains alongside on-premises monitoring may find OpManager's integration options limited. The growth of AI-driven SaaS platforms is reshaping how mid-market teams think about software investments across the board.
Best for: Mid-market IT teams that need network and server monitoring in a single affordable platform without enterprise licensing costs.
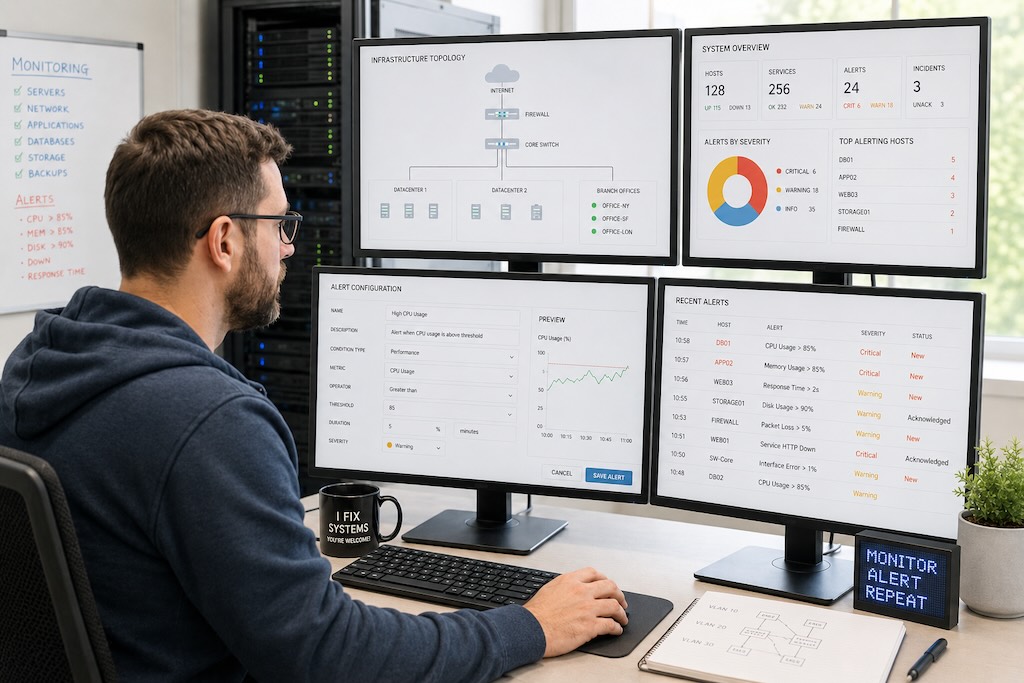
How to Choose the Right Infrastructure Monitoring Software
IT manager presenting a decision framework for infrastructure monitoring tool selection on a whiteboard with flowchart diagrams
The right choice depends on what's actually failing in your environment — not which tool has the longest integration list.
Small teams with under 50 hosts benefit most from a low-friction setup and predictable pricing. Larger enterprises running multi-cloud, multi-region infrastructure need polling granularity, distributed collection, and alert routing that integrates with existing ticketing systems.
Polling interval is the first real differentiator. The Uptime Institute's 2025 Annual Outage Analysis found that 80% of IT operators believe better monitoring data would have reduced the impact of their last significant outage. A tool collecting at 30-second intervals misses sub-minute events entirely — and those are often the ones that cascade.
Cost structure is the second differentiator, and it matters more now than it did three years ago. Per-host or per-metric billing compounds quickly in dynamic environments where instance counts fluctuate. The financial exposure from a single major outage often exceeds the annual cost of a monitoring platform — Harvard Business Review's analysis of the 2024 CrowdStrike infrastructure failure makes the case directly: monitoring isn't overhead, it's risk management.
Check integration with your existing alerting stack before committing. A tool generating alerts that don't reach the right team is worse than no monitoring at all.
Conclusion
Infrastructure doesn't fail on a schedule. CPU spikes, memory leaks, and network saturation events happen in seconds — and monitoring that updates every 30 seconds isn't built for that reality.
Netdata makes sense for teams that need maximum granularity and open-source control with no per-host cost ceiling. Datadog and New Relic make sense for teams already standardized on those platforms. Prometheus and Grafana suit teams with the DevOps capacity to run their own stack. Zabbix and Nagios serve enterprises with large, stable on-premises environments.
Match the tool to your infrastructure scale, your team's operational capacity, and the cost of an hour of downtime. That last number should drive the decision more than any feature comparison.
About the author: Slobodan Kacavenda is a technology writer specializing in software and IT infrastructure topics. With a background in digital strategy and over five years covering business technology, he breaks down complex tools and systems for teams evaluating their next investment.