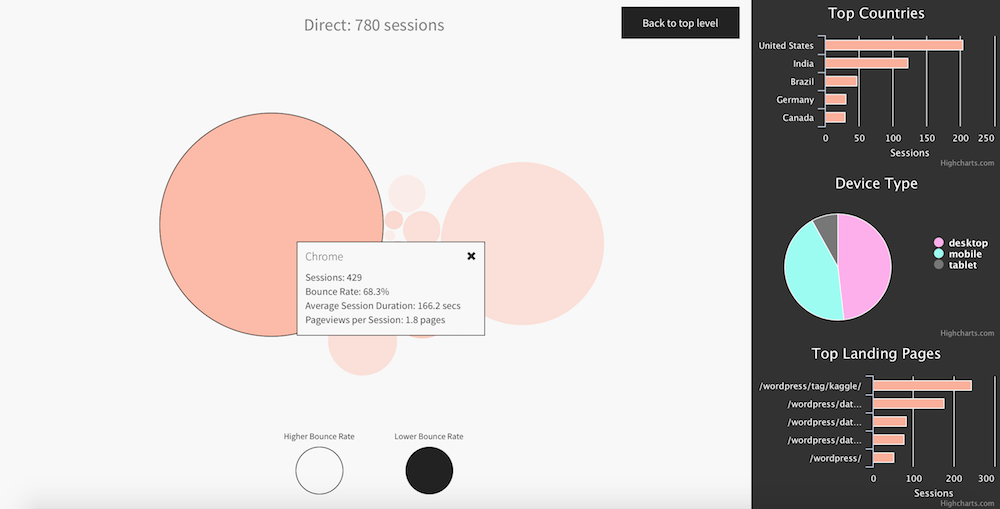
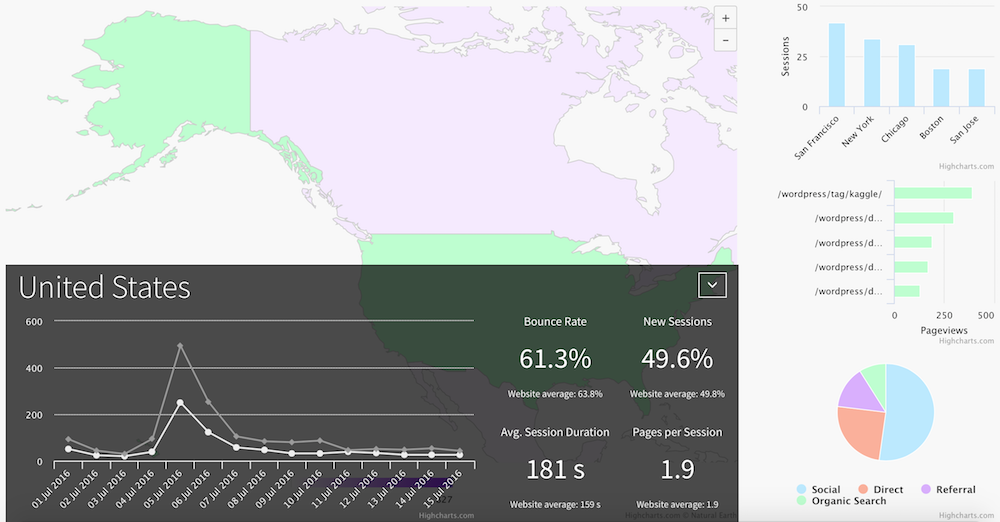
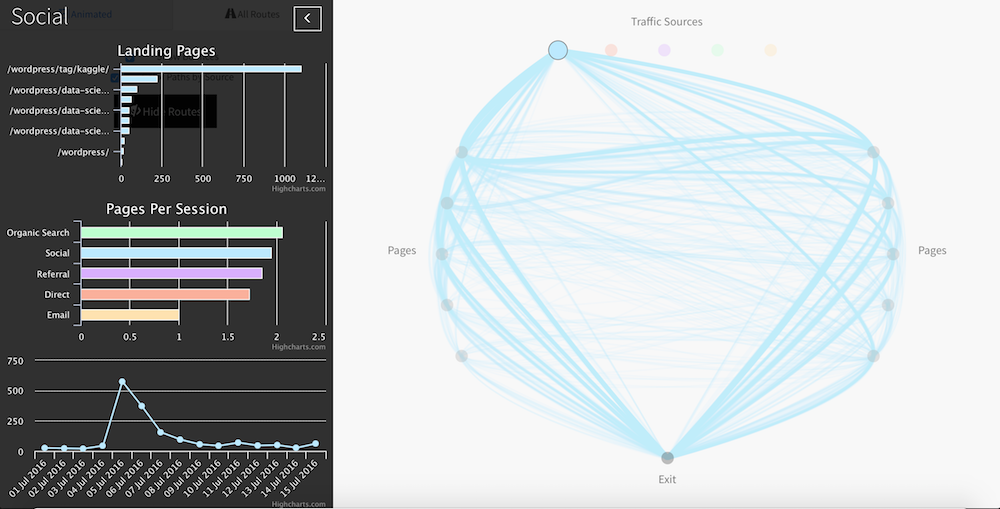
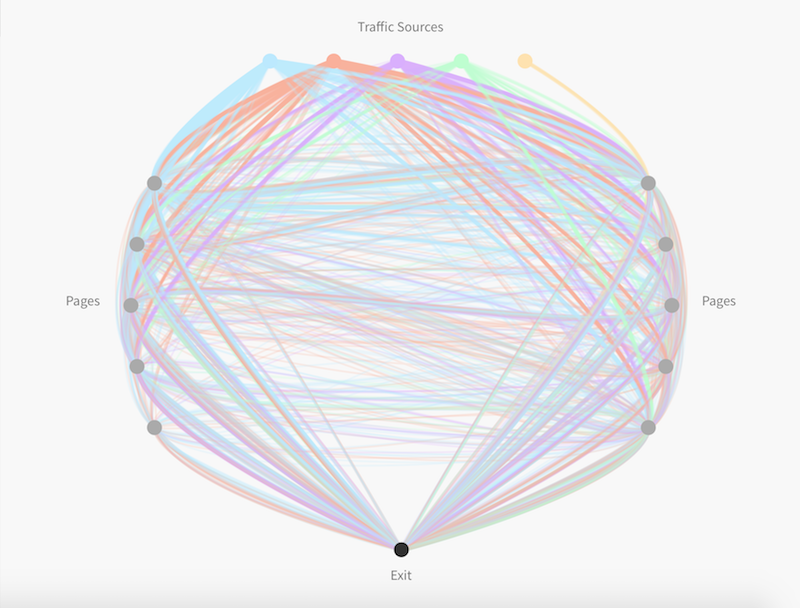
Visual Analytics is a free application that allows you to view your Google Analytics data using a range of intuitive and interactive visualizations. These visualizations help you to really understand where your users are coming from, how they are getting to your website, and what they are doing when they get there. Intended as a supplement to your existing Google Analytics dashboard, Visual Analytics aims to make your data more intuitive, interesting, and accessible.
Published At