Why use Syft? Financial data can be tedious and difficult to interpret. Syft visualizes your financial data in a simple and easy to use dashboard that enables you to quickly identify trends and variances. What reports on my business does Syft produce? Syft is built to give you a rapid oversight of your business in under a minute. We graph trends and comparatives between income, expenses, customers, suppliers, inventory and cash. We then produce income statement, balance sheet and cash flow statement management accounts with variance analysis. Lastly, we calculate the key performance ratios for your business.
Syft Analytics
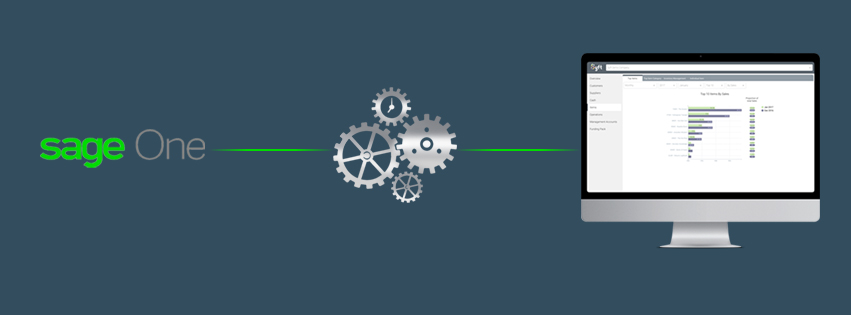
Syft is a cloud analytics platform that directly links into your existing accounting cloud software.
Published At