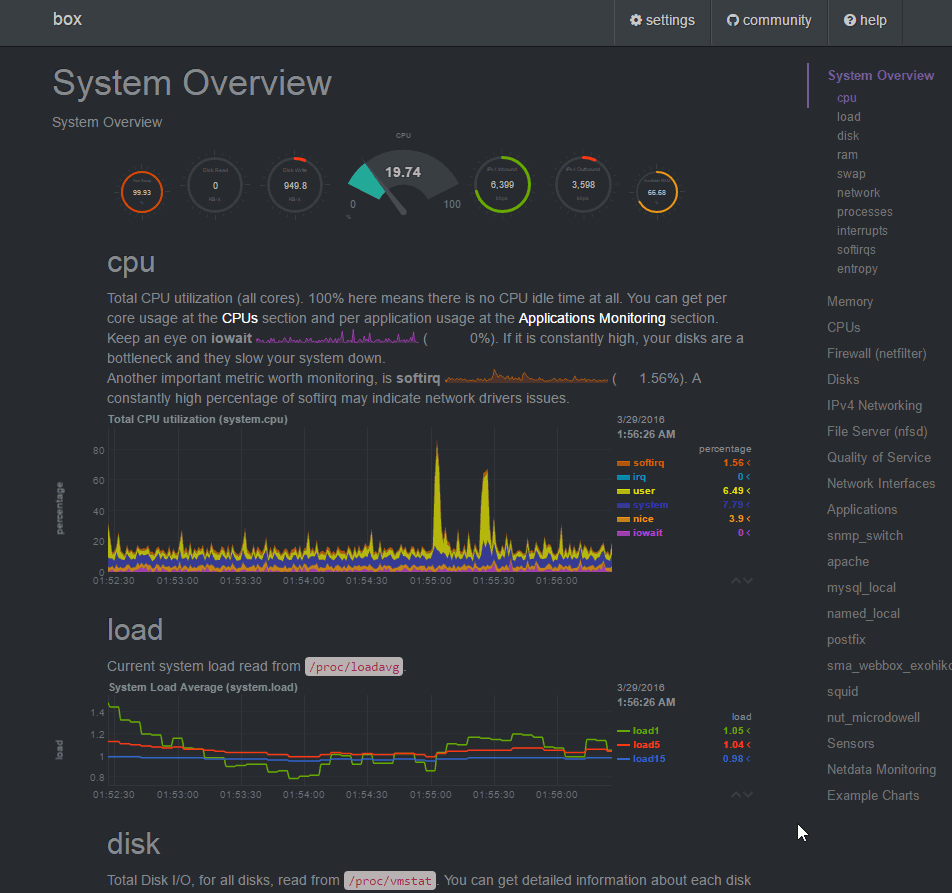
Unparalleled insights, in real-time, of everything happening on your systems and applications, with stunning, interactive web dashboards and powerful performance and health alarms. Analyse thousands of metrics per server. Everything about the system (CPU, RAM, disks, network, firewall, QoS, NFS, etc) and detailed performance metrics for dozens of Linux applications (such as web servers, databases servers, email servers, DNS servers, etc) and SNMP devices. Alarms can be set on any metric monitored by netdata. Alarm notifications are role-based and support dynamic thresholds, hysteresis and can be dispatched via multiple methods (such as email, slack.com, pushover.net, pushbullet.com telegram.org, twilio.com). netdata collects thousands of metrics per server per second, with just 1% CPU utilization of a single core, a few MB of RAM and no disk I/O at all.
SponsoredGuest Post Watch:
Protect your paid backlinks Automatically. Track, monitor, and enforce backlinks you pay for or exchange.