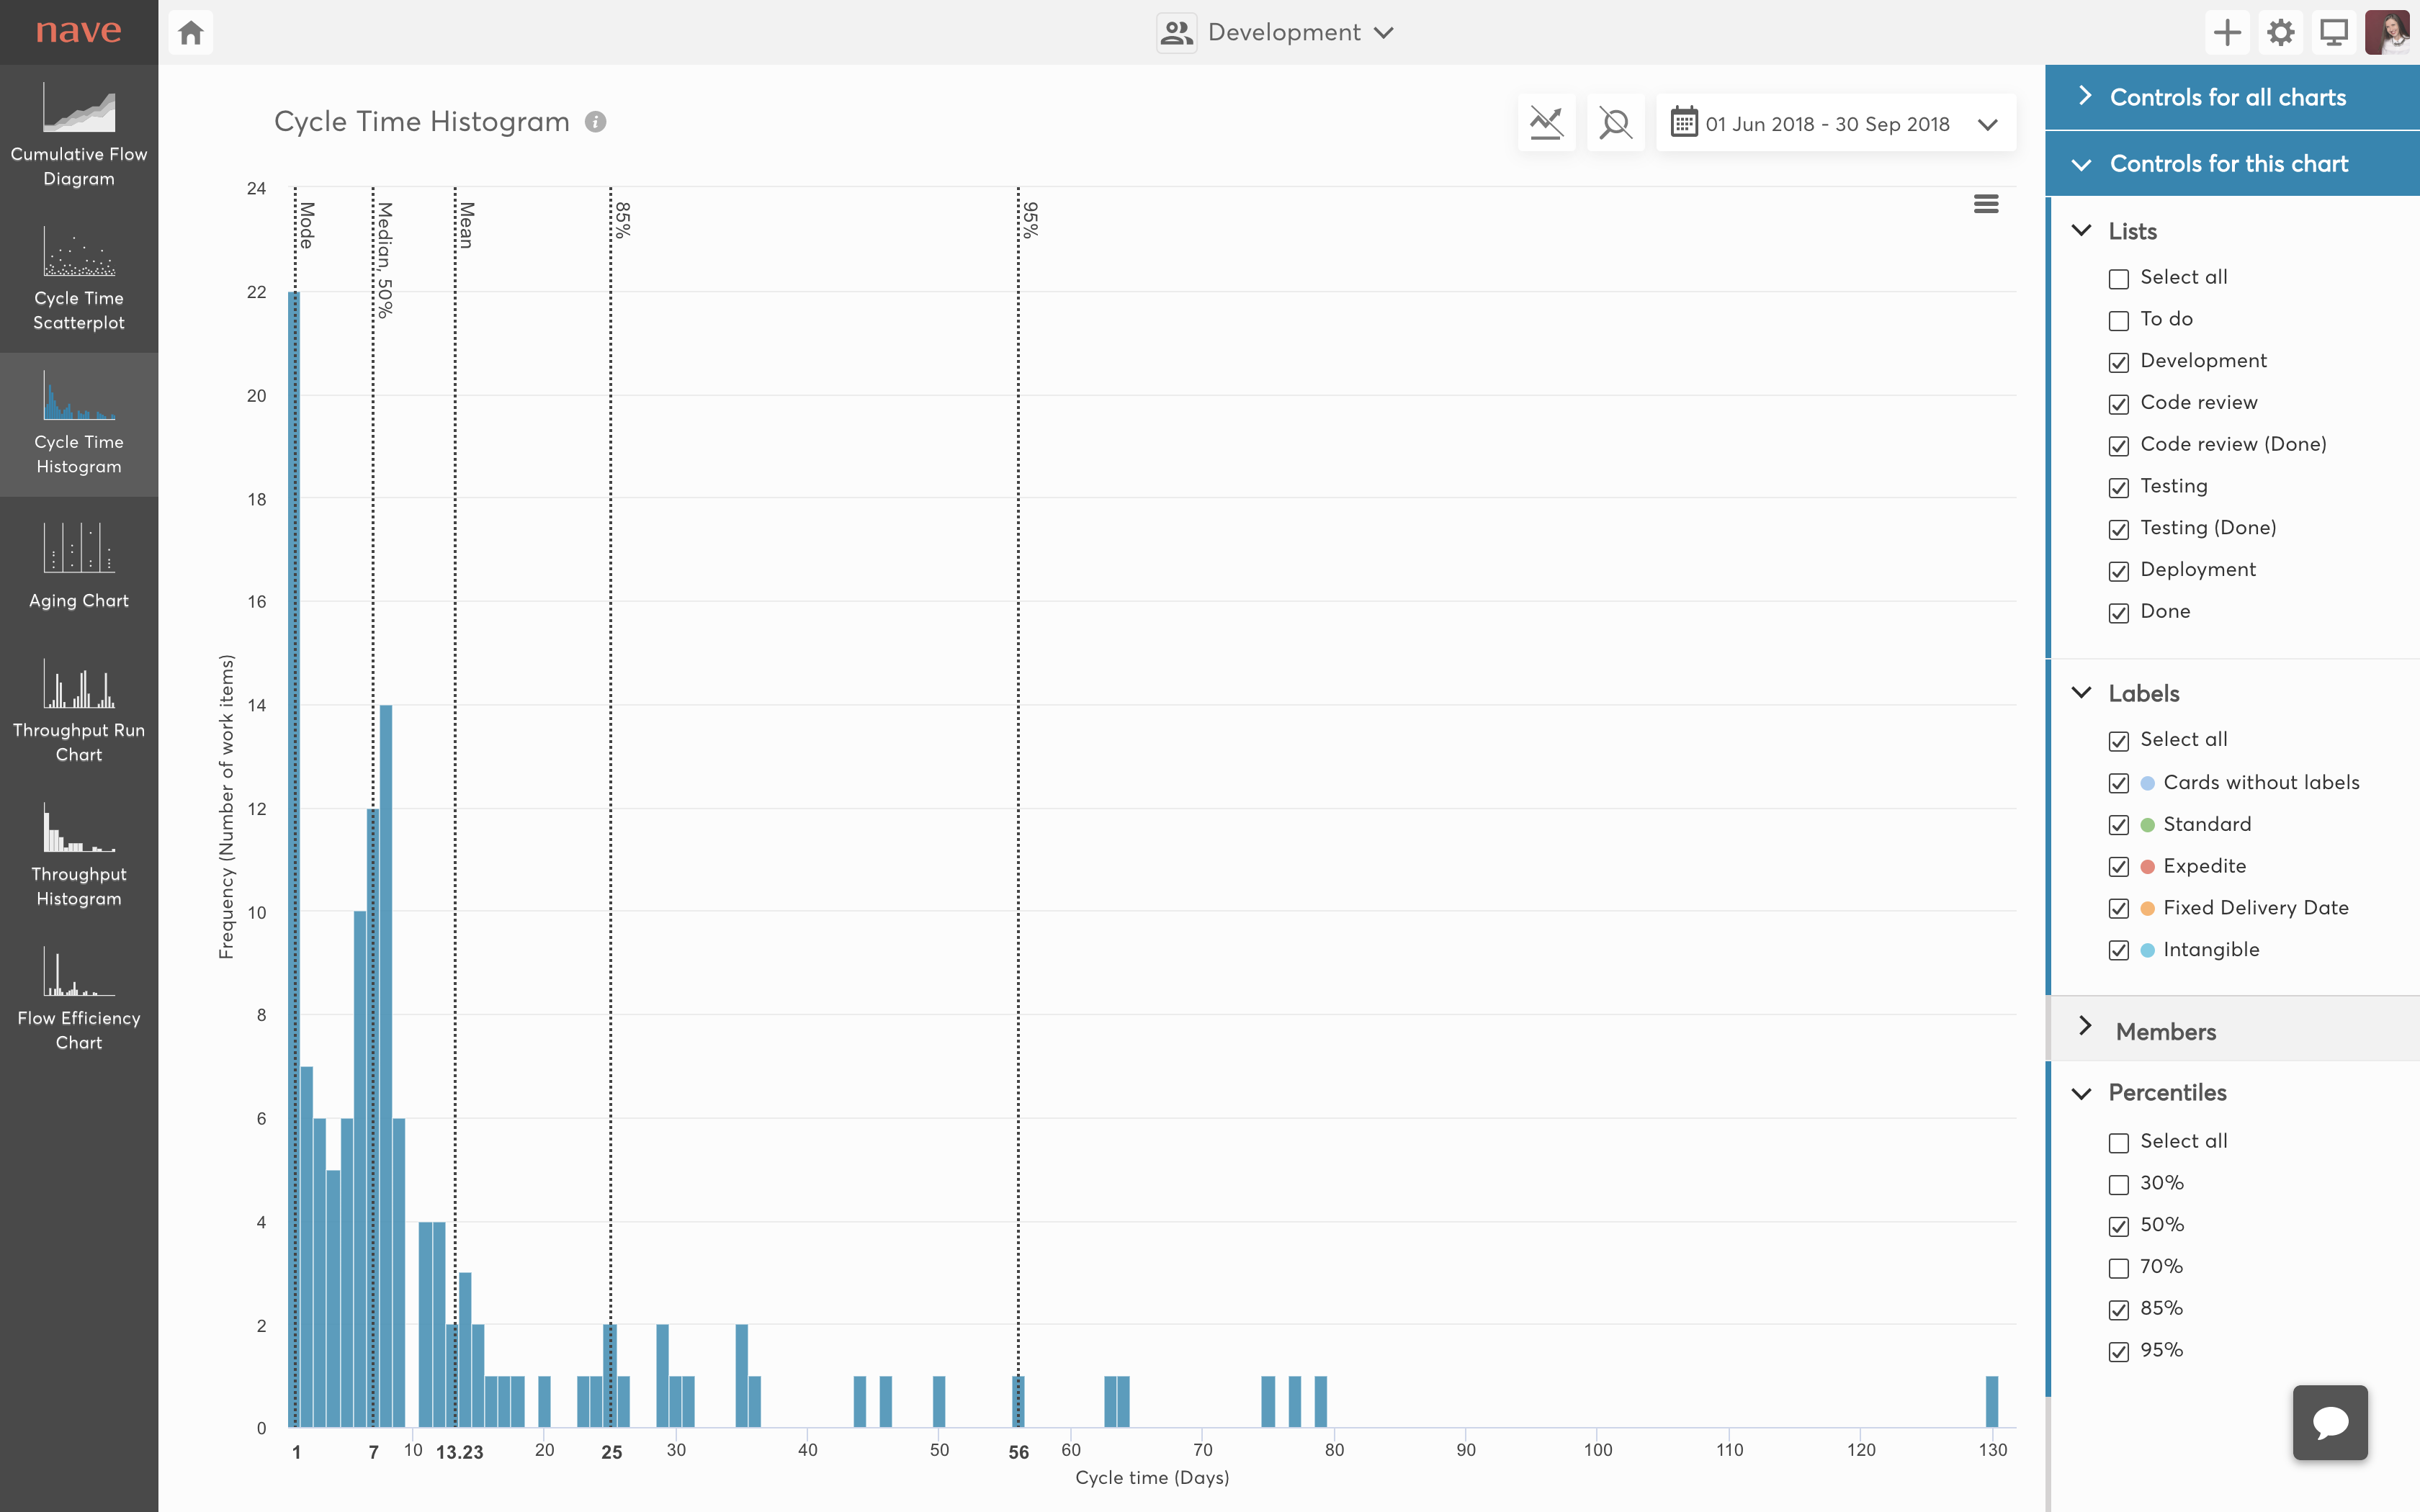
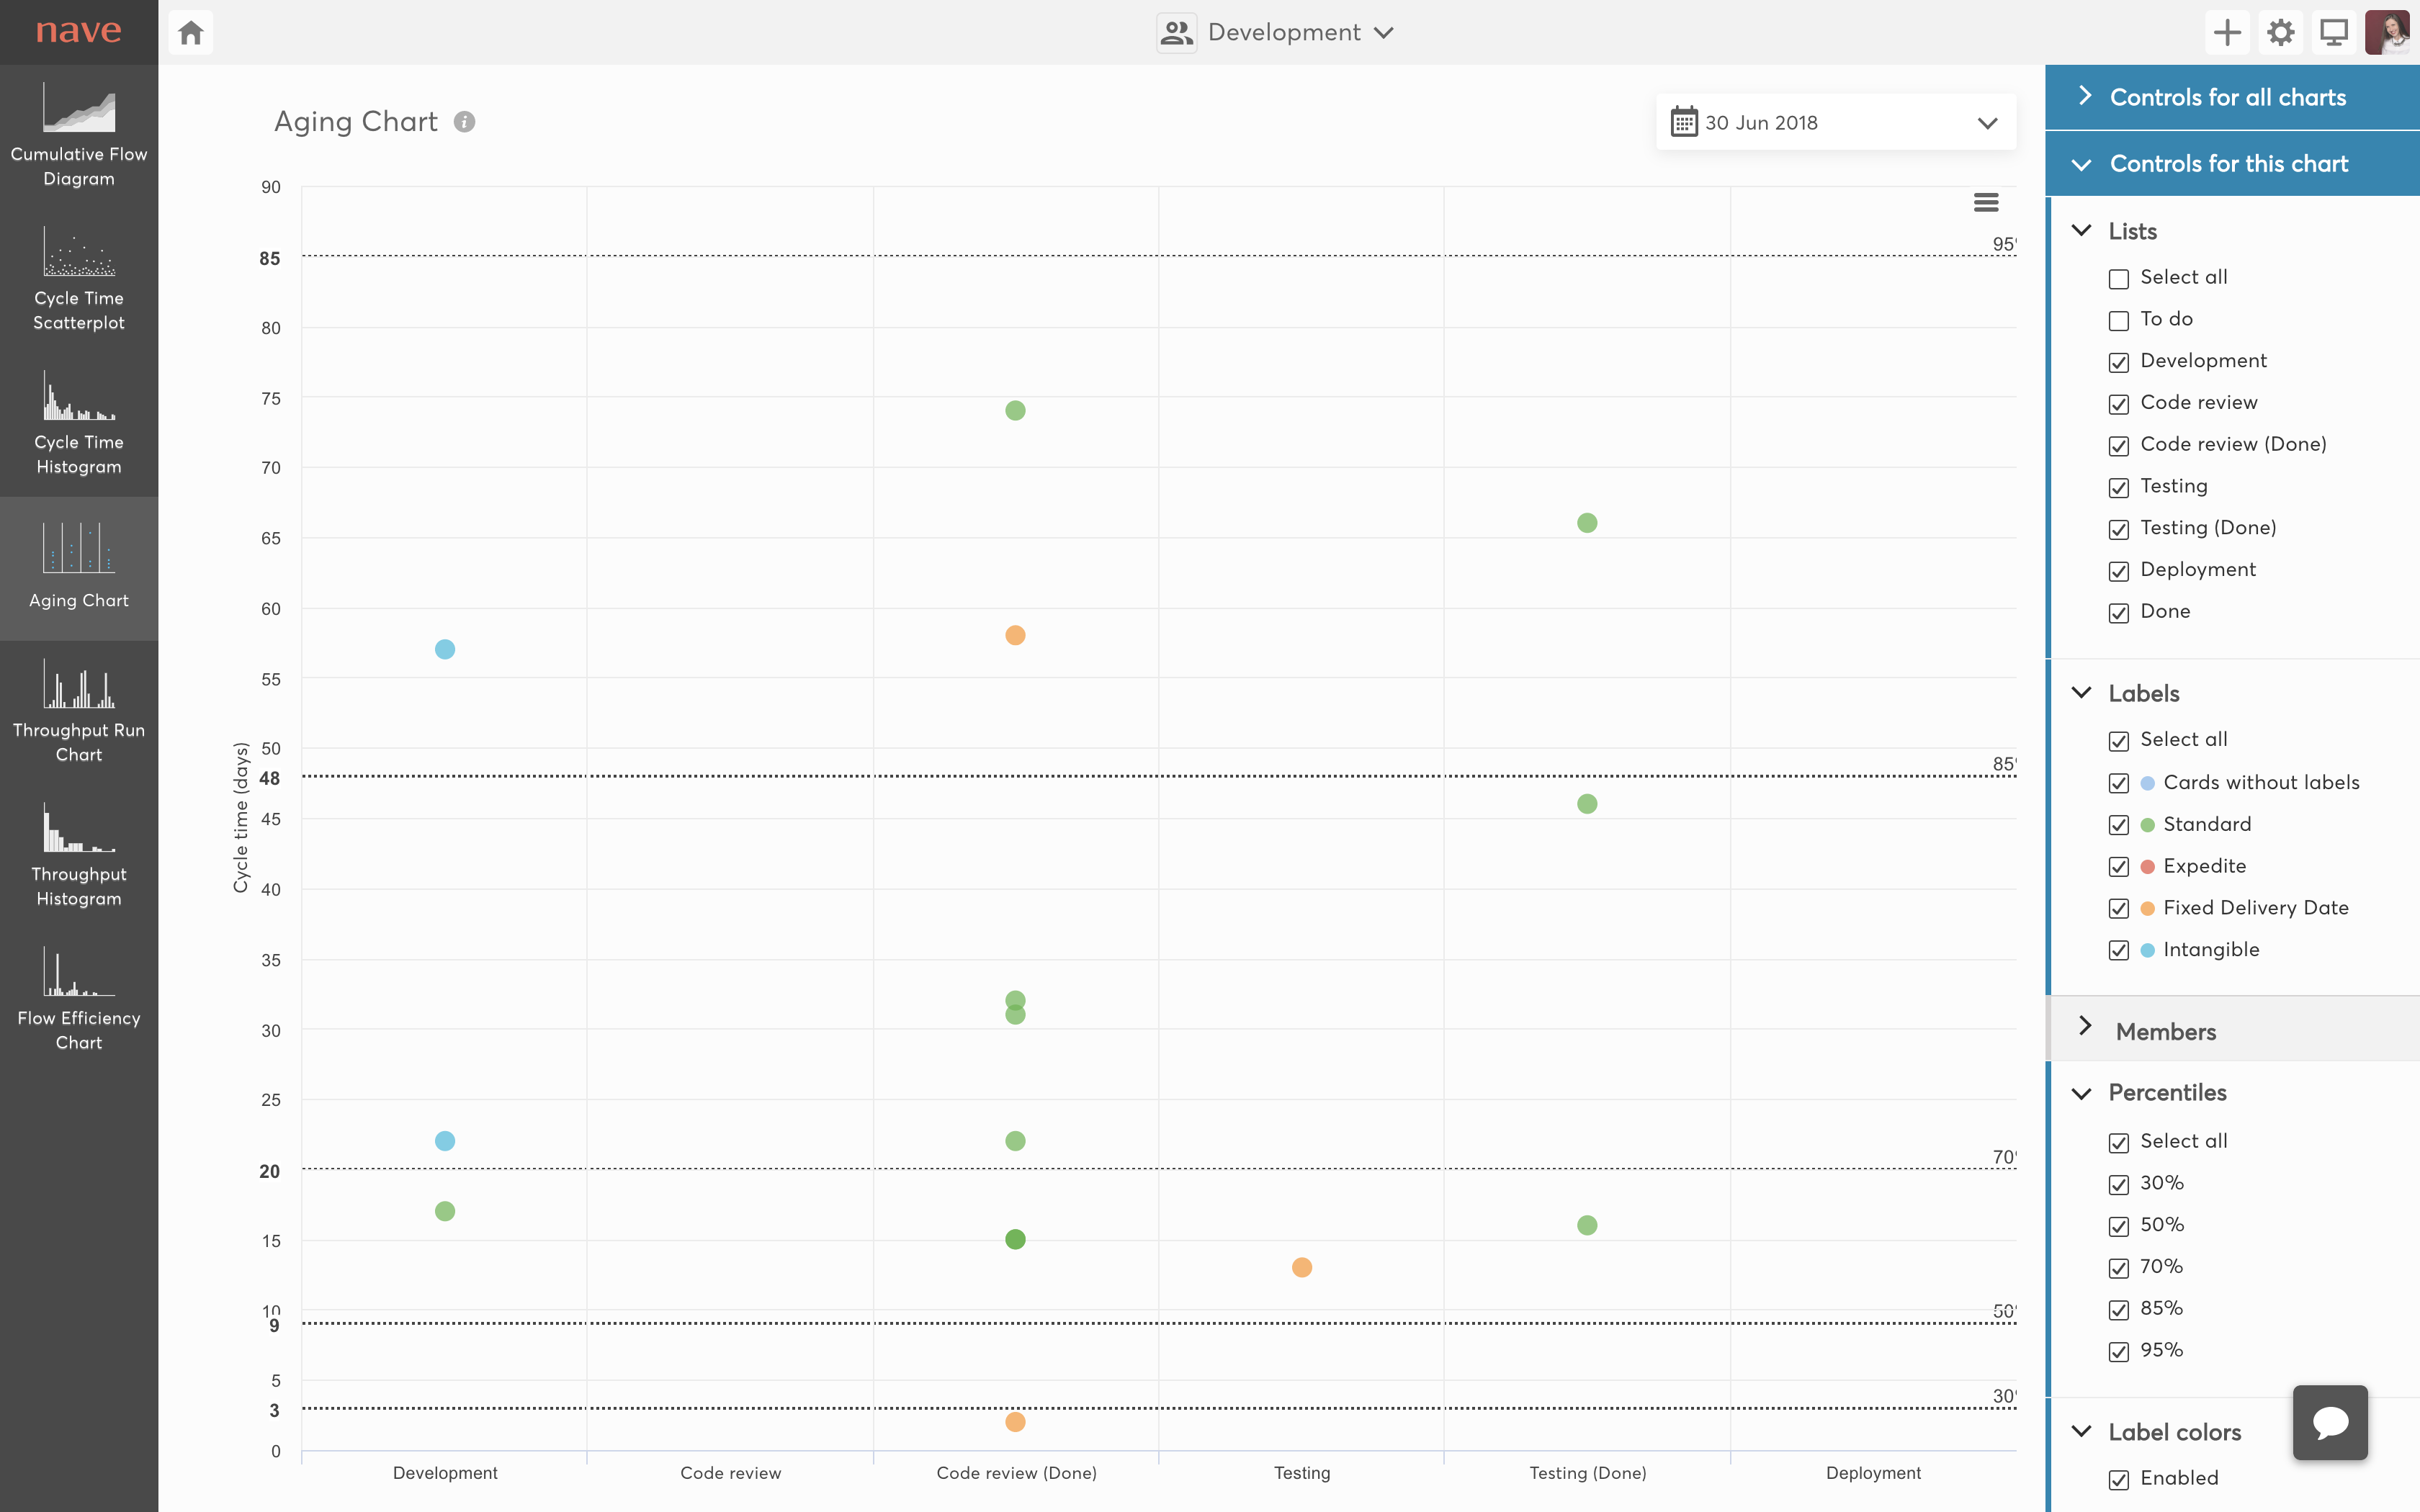
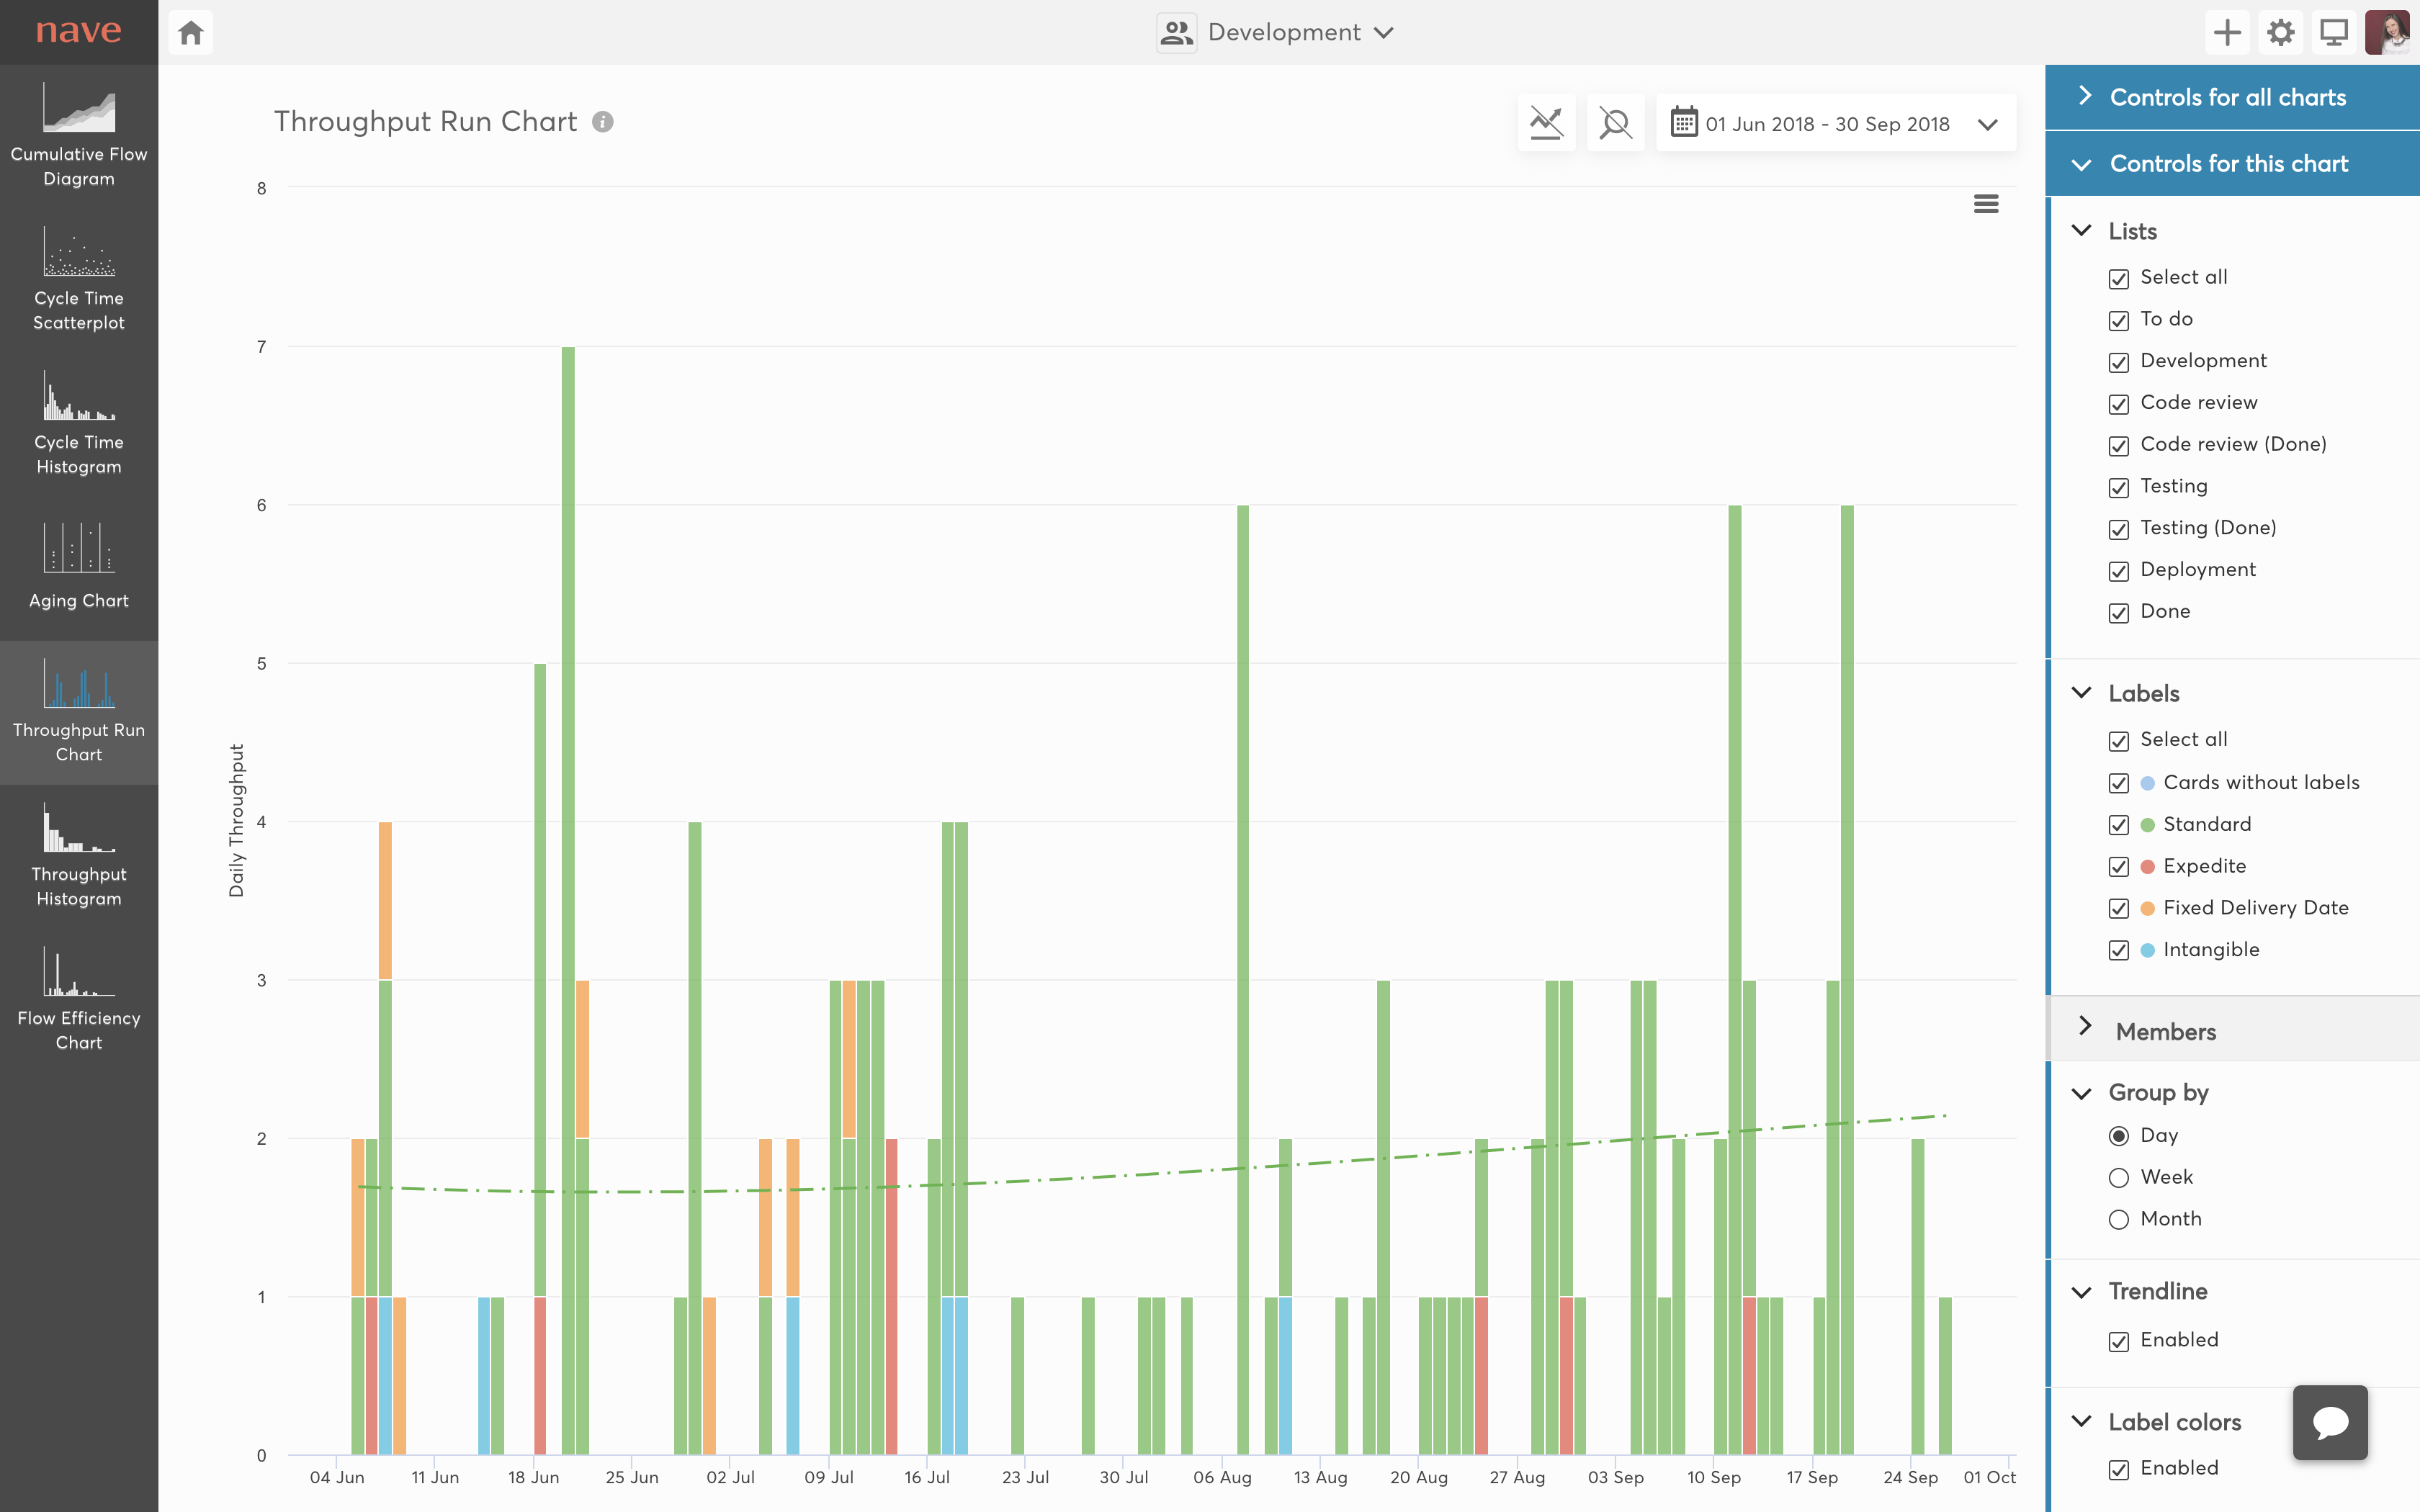
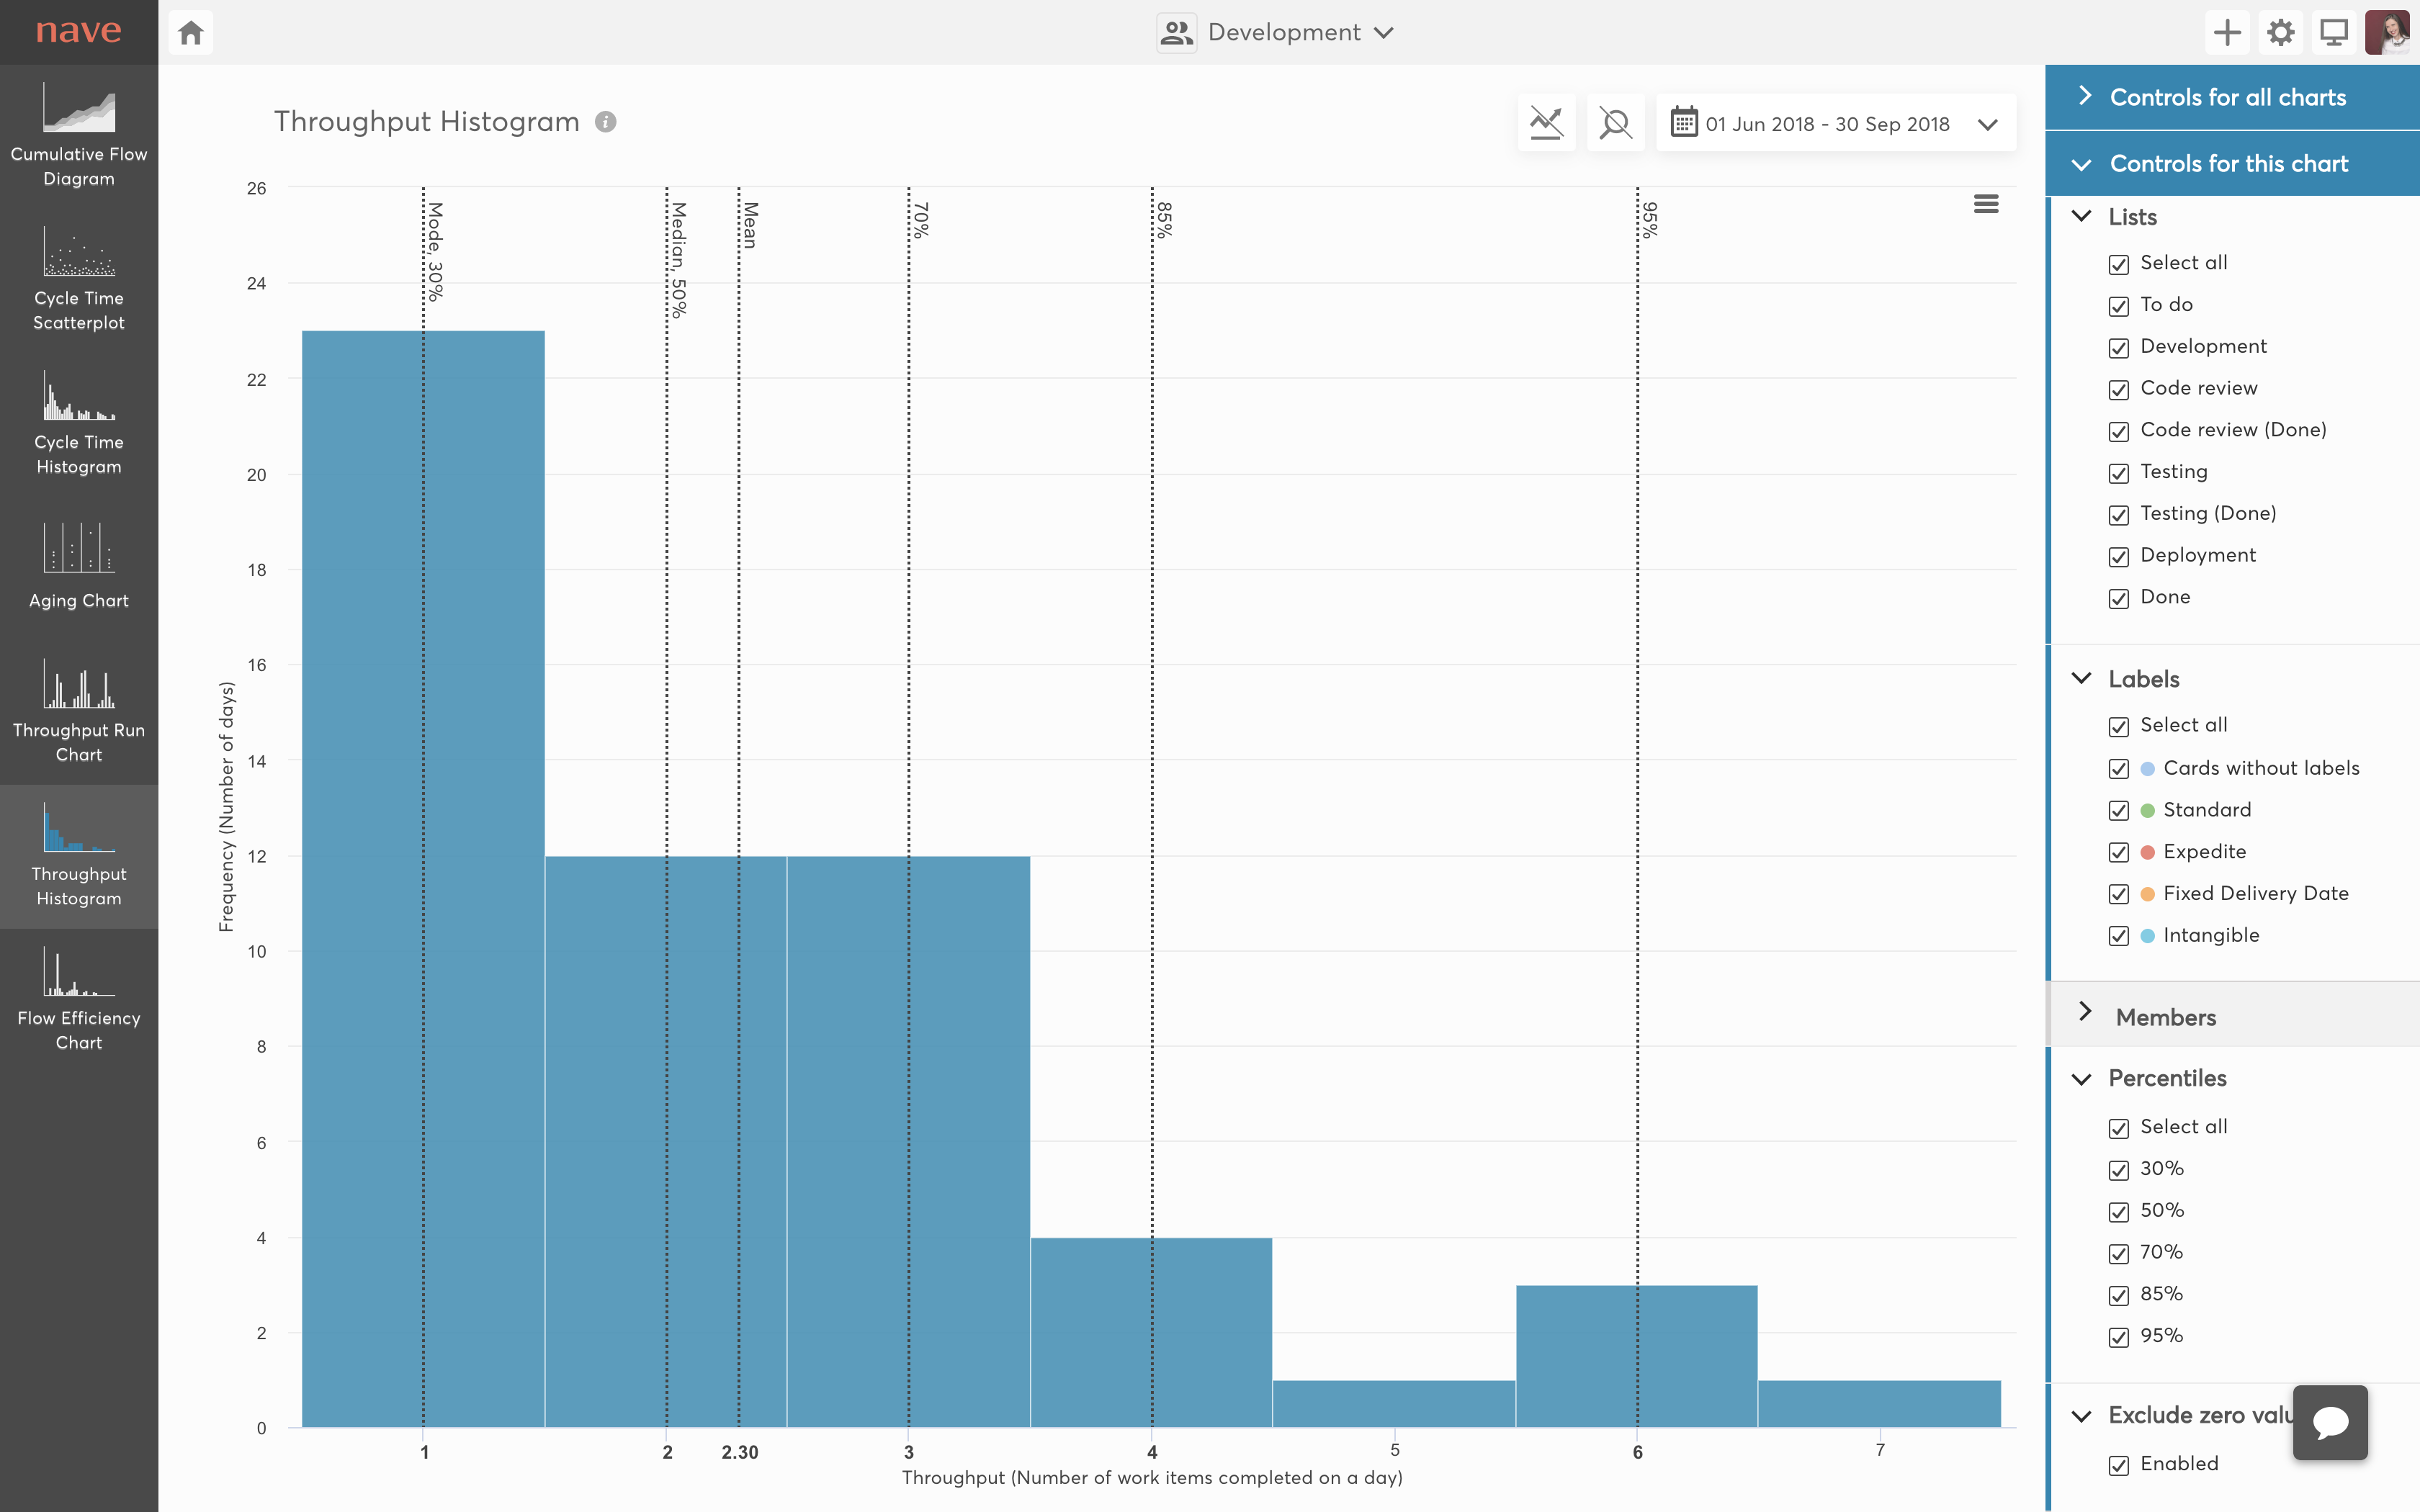
Nave helps you increase your performance, identify problems with ease and focus on improving workflow efficiency. Our dashboards reveal the fundamental characteristics of your Kanban process. We have enhanced the industry standard analytical charts for Kanban to help you reach your full potential! We integrate with some of the most popular platforms like Jira, Trello, Asana and others. With Kanban Analytics, you can: * Evaluate your workflow performance * Analyse lead times and cycle times * Identify bottlenecks as they occur * Make probability based, data-driven estimates * Trace productivity patterns * Calculate your work delivery rate * Measure your team's productivity * Monitor the time work spends in progress * Assess the efficiency of your workflow Our (current) data visualisation tools: * Cumulative Flow Diagram * Cycle Time Scatterplot * Cycle Time Histogram * Aging Chart * Throughput Run Chart * Throughput Histogram * Flow Efficiency Chart