

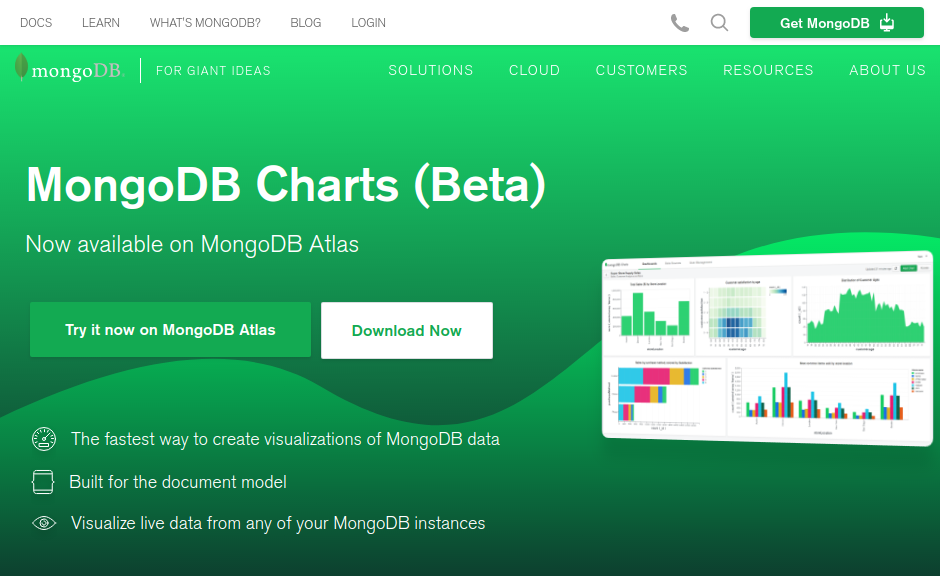
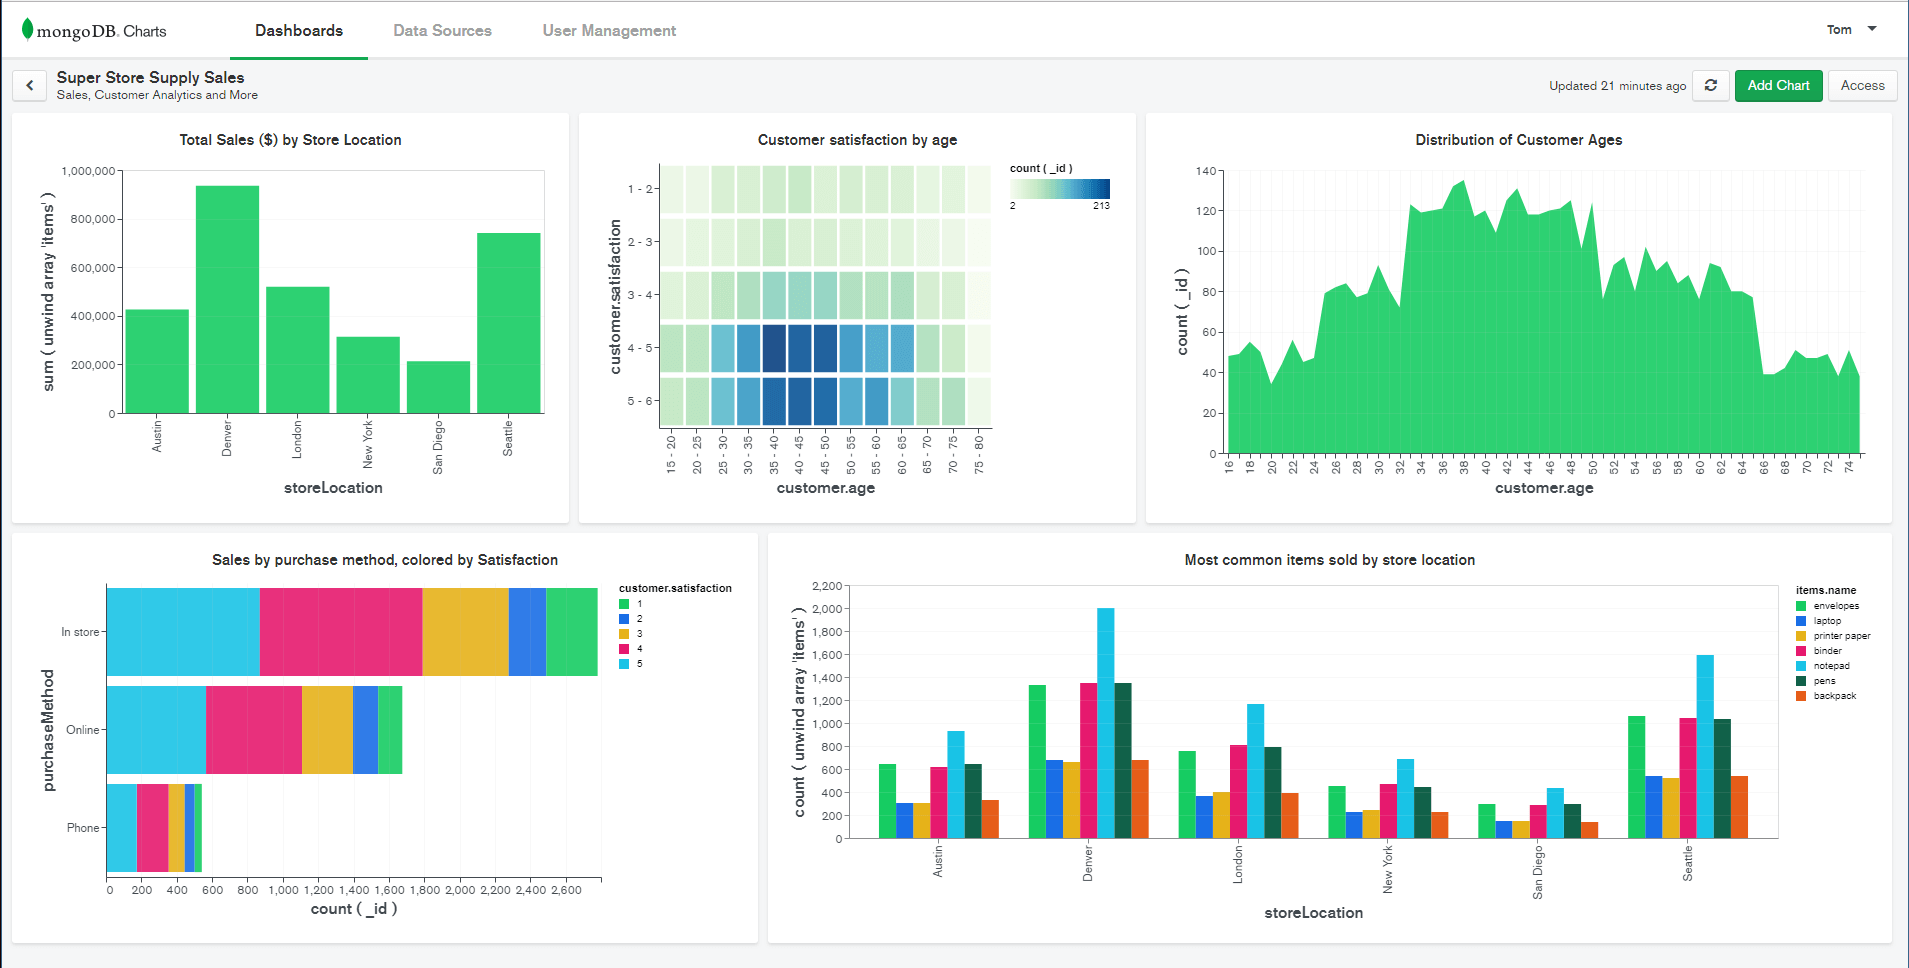
MongoDB Charts is the fastest and easiest way to create visualizations of MongoDB data. Connect to any MongoDB instance as a data source, create charts and graphs, build dashboards, and share them with other users for collaboration. -Analyze Produce insights quickly by visually exploring your data -Collaborate Share dashboards so that all the right people can work together -Take Action Track KPIs in real time with dashboards, giving you an up-to-the-minute view of your business -Work with complex data -Fully integrated with MongoDB Atlas -Connect to any data source securely -Build dashboards and charts -Share dashboards and collaborate
Published At